On the proof UI, you can monitor Executions by selecting the Monitoring from the menu.
Execution Monitoring
The Execution Monitoring is the main interface to run, execute, and stop executions and check logs in PROOF.
1. Monitoring Table
This interface allows you to monitor the status of executions, including their execution status, logs, and other relevant information.
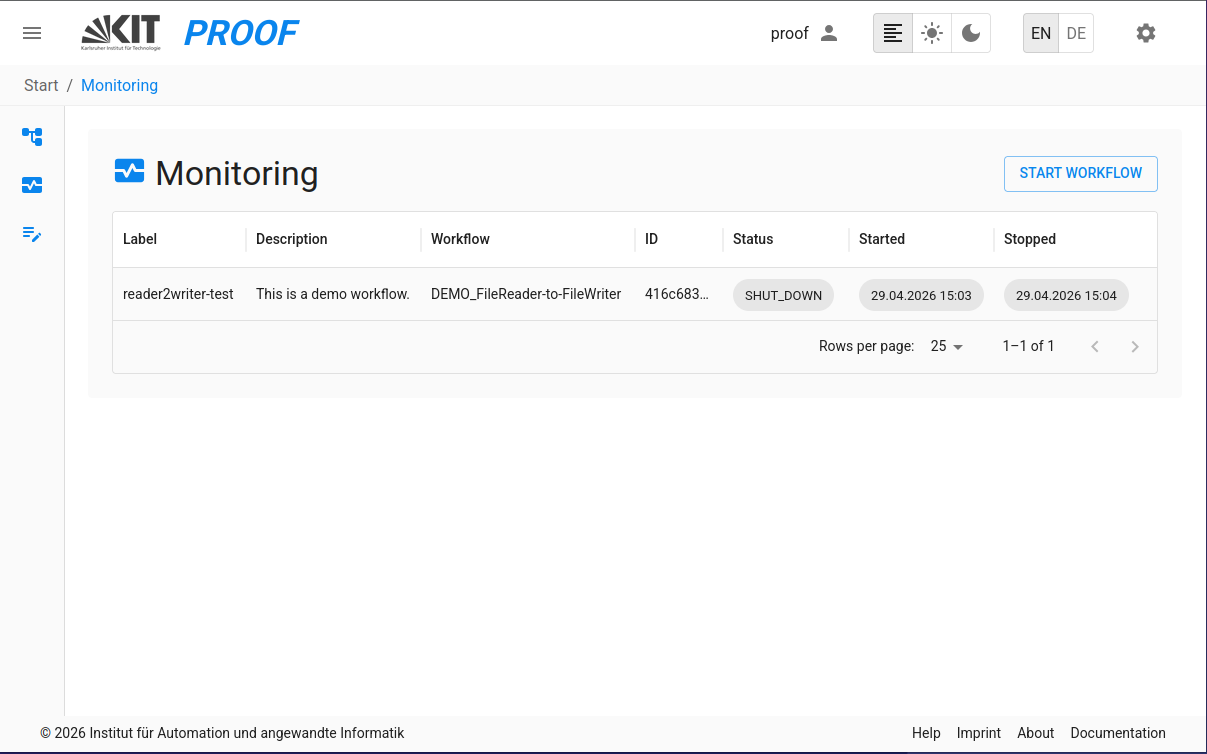
By clicking "START WORKFLOW" the a dropdown list with all available workflows appears. After a workflow is selected in the dropdown list, it can be executed by clicking on the "EXECUTE" button in the top right corner of the Execution Monitoring interface.
2. Execution Progress Tracking
During execution, PROOF provides real-time progress tracking:
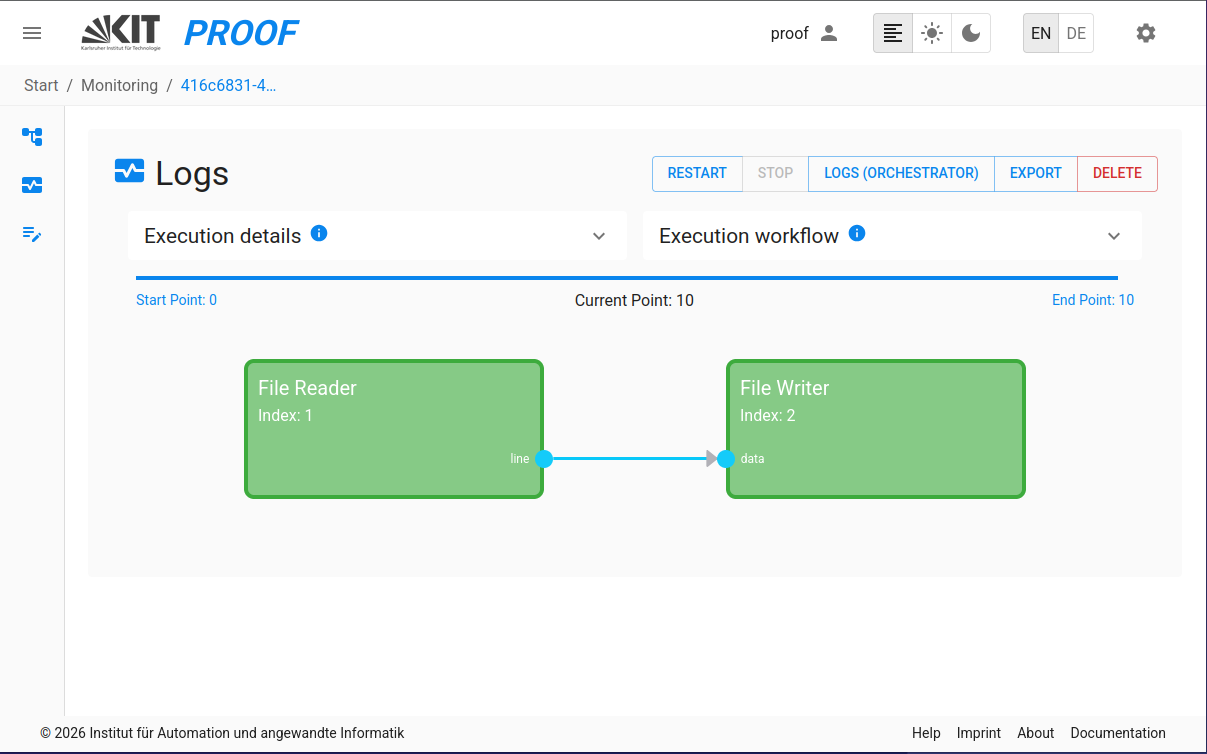
- Progress Visualization: Visual progress bars showing the current state of execution
- Communication Point (CP) Tracking: See the current communication point being processed
2.1. Block Status Monitoring Service
The Block Status Monitoring Service provides real-time visualization of individual block execution states:
- Real-time Block Status Updates: Monitor individual block states and communication points
- Block-specific Logs: Monitor the logs of individual blocks in real-time
- Status Indicators: Visual indicators showing each block's current state (INIT, EXECUTE, FINALIZE, SHUTDOWN)
- Log Storage: Model logs are automatically saved in proof-environment/data/executions/ organized by execution ID as specified in the docker-compose file
2.2 Data-Flow Visualization
During an execution, PROOF visualizes how data flows between the Blocks of a Workflow. This also allows you to inspect all ports of a Block independently of the connection layout.
- Data Visualization: Input and output values between Blocks can be accessed by clicking on a connection, in- or output.
- Connection: See the actual data values that are sent from one Block to another.
- Output: See the published data values for this output.
- Input: See the data values received in this input.
- Basic Data-Flow Visualization: A basic representation of the data flow direction and activity between connected Blocks.
- Highlights the active path of data exchange during execution.
2.3 Log Window Improvements
By clicking on the respective blocks the log view for these blocks can be accessed.
2.4 Execution Settings
The collapsable section at the top holds all information about the configuration that was used for this execution.
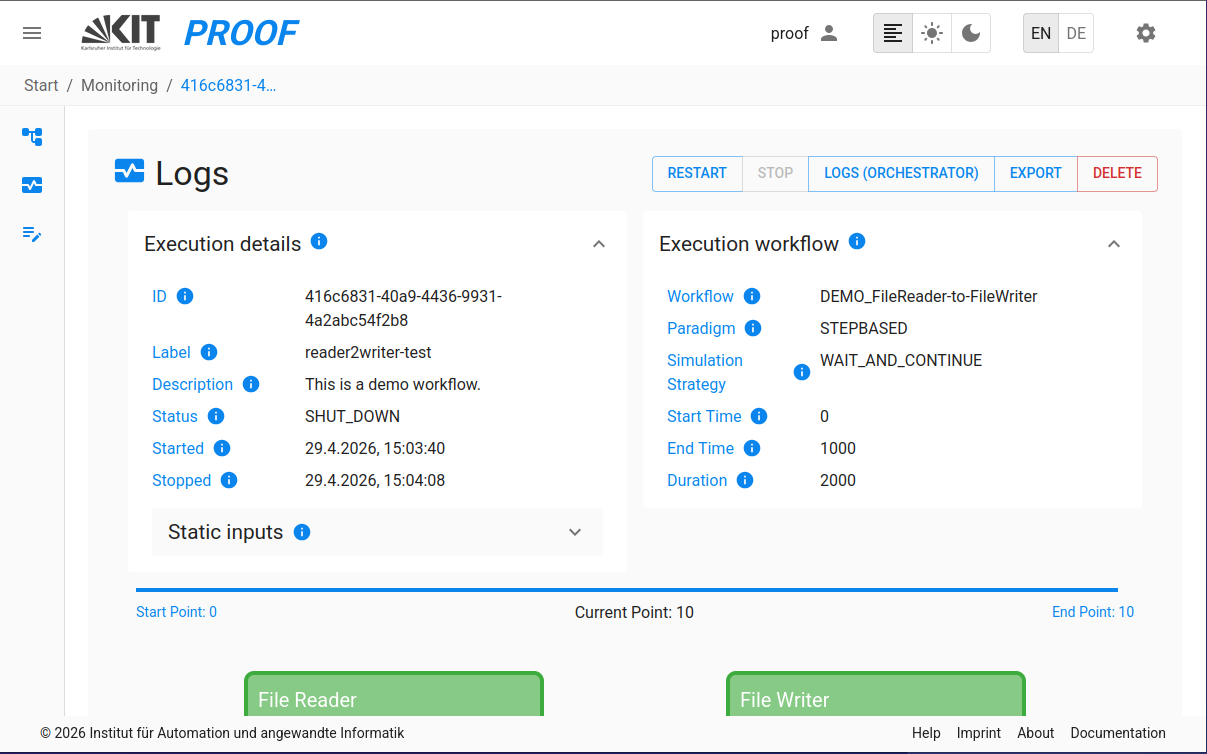 - Input Values Display: View input values and workflow parameters for the execution
- Execution Parameters: Full visibility of execution start and run parameters in the monitoring view
- Detailed execution settings display with better layout and readability
- View all execution configuration details
3. Export Executions
- Export Execution: Export a complete workflow execution as a ZIP file, including all configurations, templates and attachments. This feature is available to all users.